Python or R for Data Analysis: An In-Depth Comparative Guide

Intro
In the vast landscape of tools and languages for data analysis, two names often top the list - Python and R. Both are leading stars in the data science arena, each boasting specific features that make them popular among data enthusiasts. If you're finding yourself tangled in the "Python vs R" debate, this comprehensive guide will provide a detailed analysis of both languages, focusing on their capabilities in data analysis.
Setting the Stage: Understanding Python and R:

Python and R are versatile, open-source programming languages that have significantly influenced the world of data analysis and statistics. Python is renowned for its simplicity, flexibility, and all-purpose programming capabilities. In contrast, R, while not as general-purpose as Python, has a strong suite of features specifically designed for data analysis and visualization.
Python in Data Analysis
Key Advantages:
Flexibility and User-Friendly
With a straightforward syntax, Python is highly user-friendly, even for those new to programming. Its flexibility extends beyond data analysis to other areas of programming, including web development, software development, and more, making it a highly versatile language.
Comprehensive Library Ecosystem
Python is backed by a wealth of libraries tailored for various data analysis tasks, providing powerful tools at the disposal of analysts. Libraries such as NumPy for numerical computation, Pandas for data manipulation, and Matplotlib for creating static, animated, and interactive visualizations make Python a favorable language for data analysis.
Robust Community Support
Python's popularity translates to a vast community of users and developers. This means more support, resources, tutorials, and code snippets, which can be highly beneficial, particularly when facing issues or looking for an optimized solution.
R for Data Analysis
Key Advantages:
Custom-Made for Statistics
R was specifically built for statisticians, and hence, it has an arsenal of advanced statistical tests built-in, more so than Python. If your analysis heavily involves statistical models, R's arsenal of packages makes it an enticing choice.
Superior Data Visualization
While Python has libraries for visualizing data, R outshines with ggplot2, a powerful graphics language in its own right. It offers greater granularity and control in creating high-level graphics, which can be crucial in laying out intricate data stories.
Comprehensive Data Analysis Packages
R boasts a suite of packages honed specifically for data analysis. Packages like dplyr for data manipulation, stringr for strings, tidyr for tidying data, and many more make data wrangling a breeze in R.
Python vs. R
Making a Choice:
Deciding between Python and R potentially boils down to the nature of your project and specific needs. If the project you're tackling requires a more general-purpose language and ease-of-use is a priority, Python fits the bill perfectly. Conversely, if your project is heavily statistical or requires complex data visualizations, R can be a more potent tool.
Conclusion
While Python and R have unique strengths and limitations, both are exceptional tools in the field of data analysis. Python’s flexibility makes it adaptable to diverse programming and data analysis tasks while R's robust statistical capabilities, combined with superior data visualization tools, make it an attractive choice for in-depth data analysis.
In the end, the key lies in understanding your project requirements and selecting the tool that aligns best with these needs.
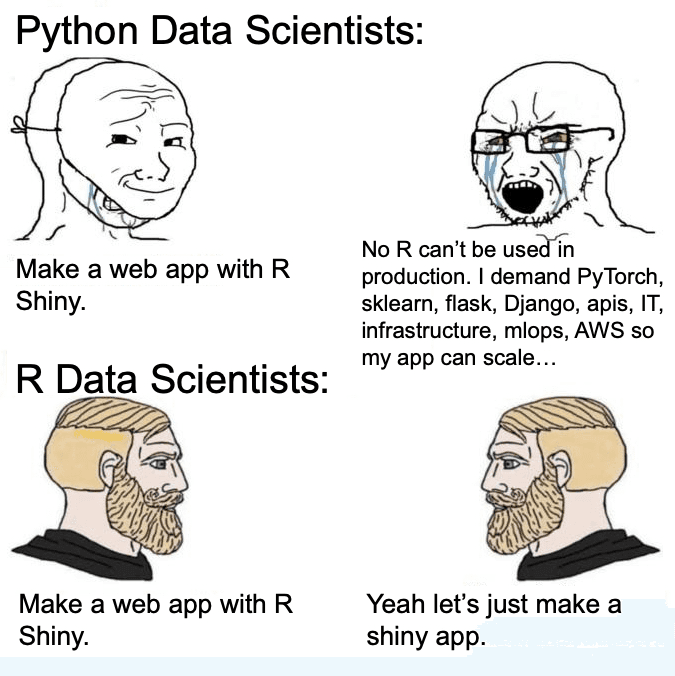
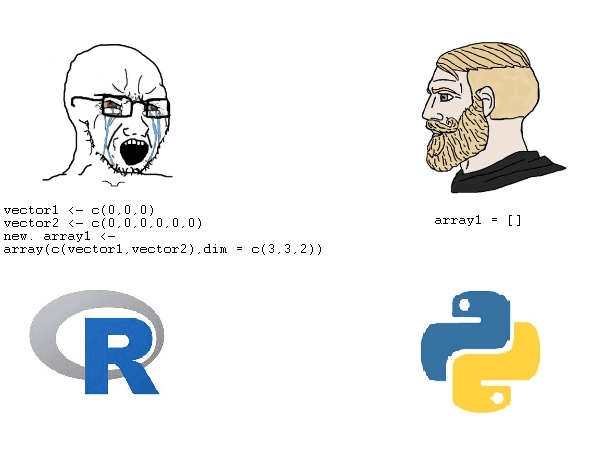
Now enjoy some memes about Python vs R:


Start building your dashboard now
without coding
