
← Back to Docs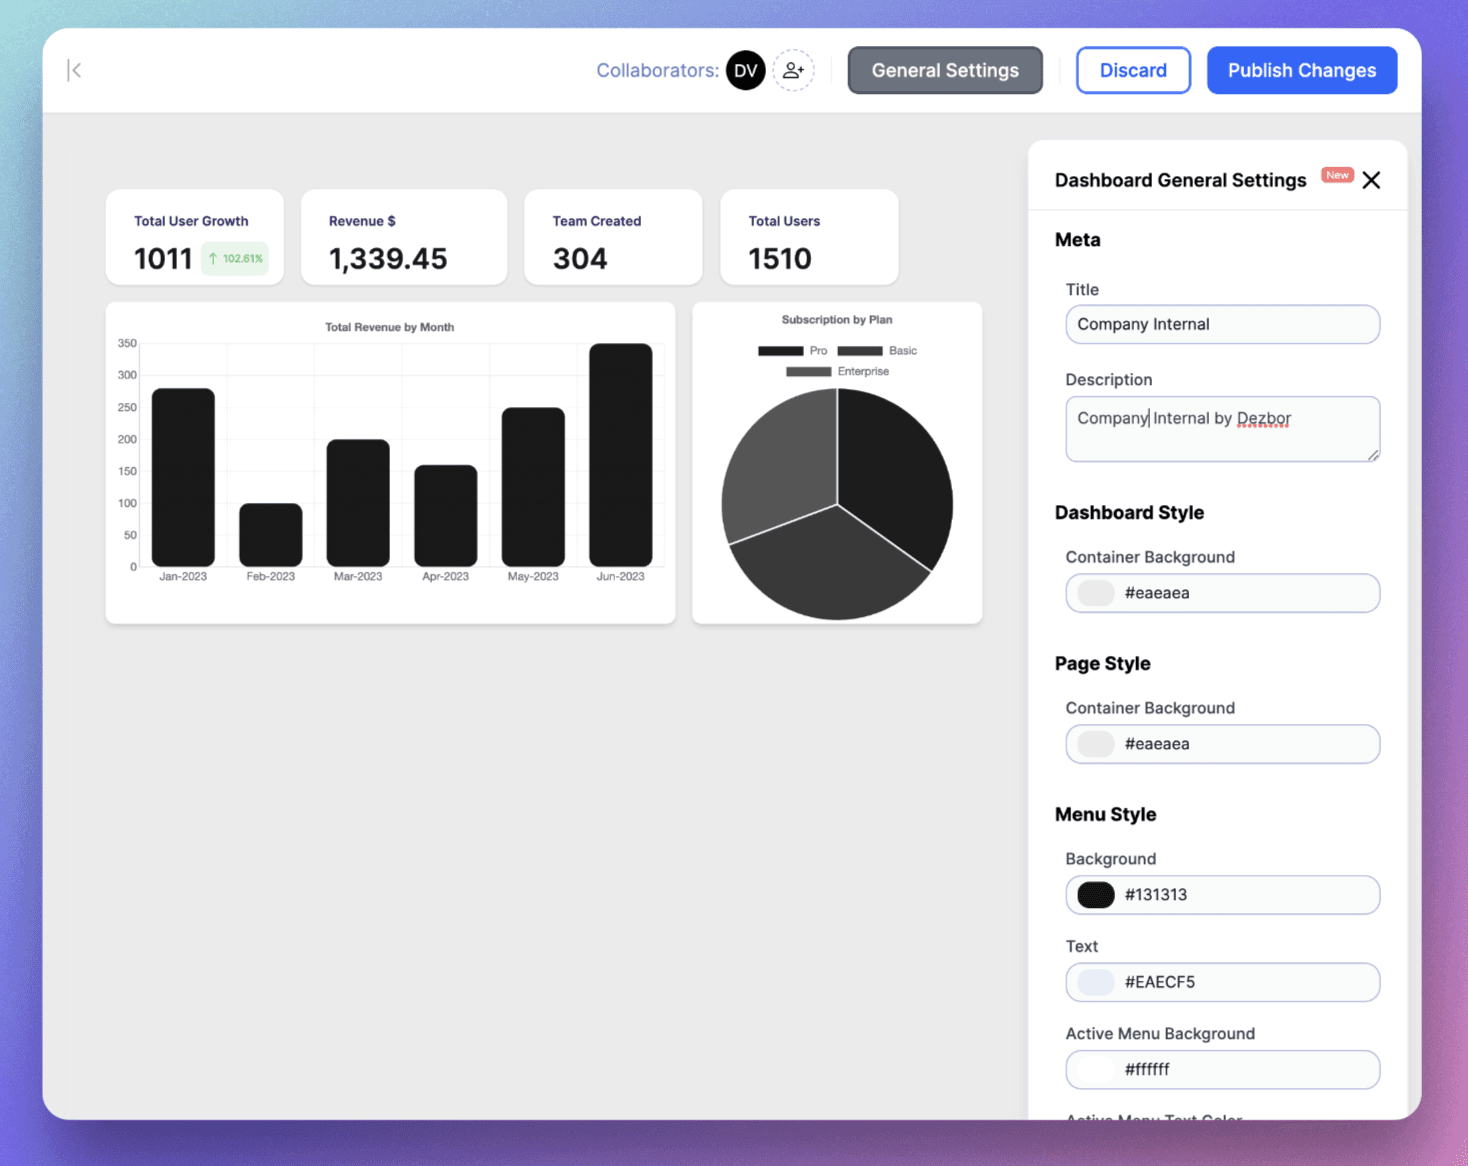
🎨
Edit and Design Your Dashboard
Build Your Dashboard
Looking to turn your dezbor dashboard into a visual masterpiece? You're in the right place. With our intuitive interface, you can easily manipulate the presentation of your data.
Entering Edit Mode
To start designing, switch to 'Edit Mode' by clicking the 'Edit' button at the top right corner of your dashboard. Now you can add or adjust components, and apply logic to them.
Click on any component on your dashboard to open its properties sidebar. Here, you can:
- Change Dashboard Style: Click on the General Settings on top right during editing mode to style the dashboard.
- Customize Component Style: Change the color, size, and other visual attributes of your components by selecting the component.
Remember to click 'Publish' after making any changes.
Dashboard Design Tips
- Keep It Simple: Keep your layout neat and functions intuitive to maintain a clear view of key data.
- Use Consistent Styling: Consistent colors, fonts and spacing make your dashboard aesthetically pleasing and easier to interpret.
- Arrange Logically: Position your most important data or charts in the top left where viewers naturally begin looking.
You can preview your changes anytime by switching back to 'View Mode'. When you're happy with your design, click 'Publish' to update the dashboard for all viewers.